Time is money, but losing money at the wrong time might cost you more than you think.
Annual Return is Only a Starting Point
If your advisor offered you the choice between two different portfolios, one with an average annual return of 7% and the other with an average annual return of 4%, which one would you want? You’d probably want the 7% average return portfolio because it’s a higher return – and with that higher return you should end up with more money overall, right? Well, it depends….
In reality the order you experience the returns, what you will hear us call the sequence of returns, matters much more than the average return. The sequence of returns affects retirees more than investors who are still accumulating for retirement because it is retirees who need to actively withdraw from their accounts. When taking withdrawals in retirement, the order in which the returns happen is what matters most when it comes to predicting whether you will run out of money.
Let’s make this more concrete with an example highlighting what sequence of returns risk is and how it would impact your portfolio. In all examples that follow:
- Returns are annual numbers (not monthly or daily),
- Retirement length is 30 years,
- Portfolios start with the same initial portfolio value of $1,000,000 and,
- Assume the investor withdraws 4% or $40,000 annually (which is adjusted for inflation).
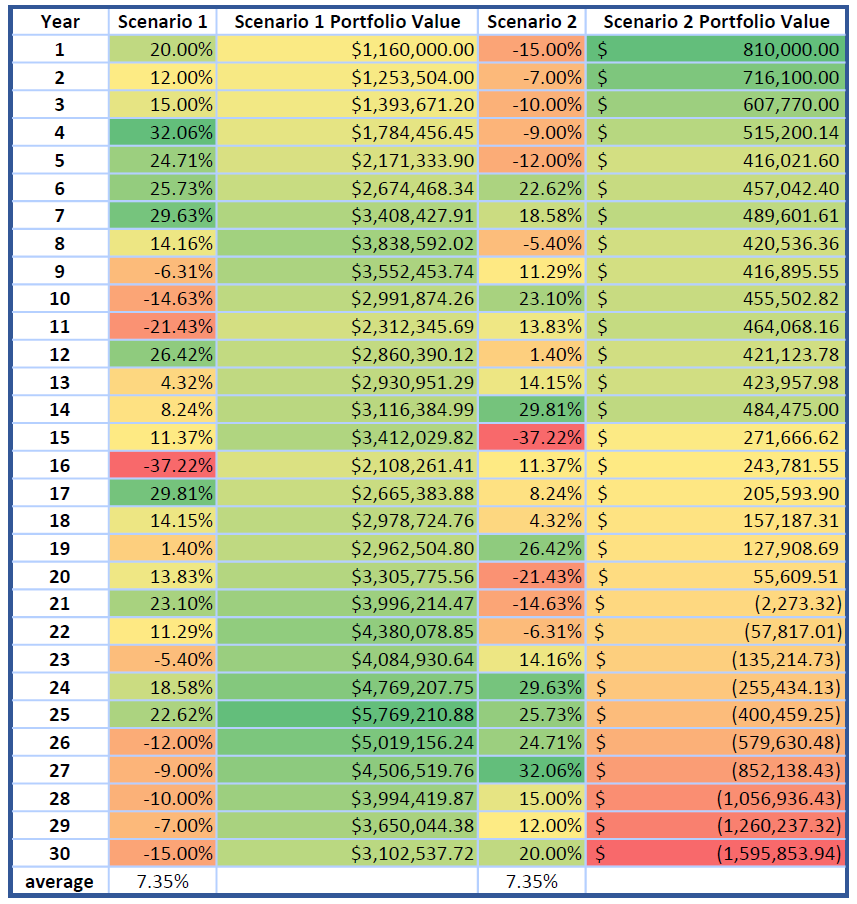
Consider Scenario 1 and Scenario 2 below – both portfolios have an average annual return of about 7% over the 30-year horizon. In fact, they have the exact same average return because all we did was flip the returns: Sequence 2 is simply Sequence 1 returns reversed. Pay special attention to the 5 negative years in a row that are at the end of Scenario 1 and the beginning of Scenario 2. Experiencing those 5 years of losses first leads Scenario 2 to run out of money after only 20 years of retirement.
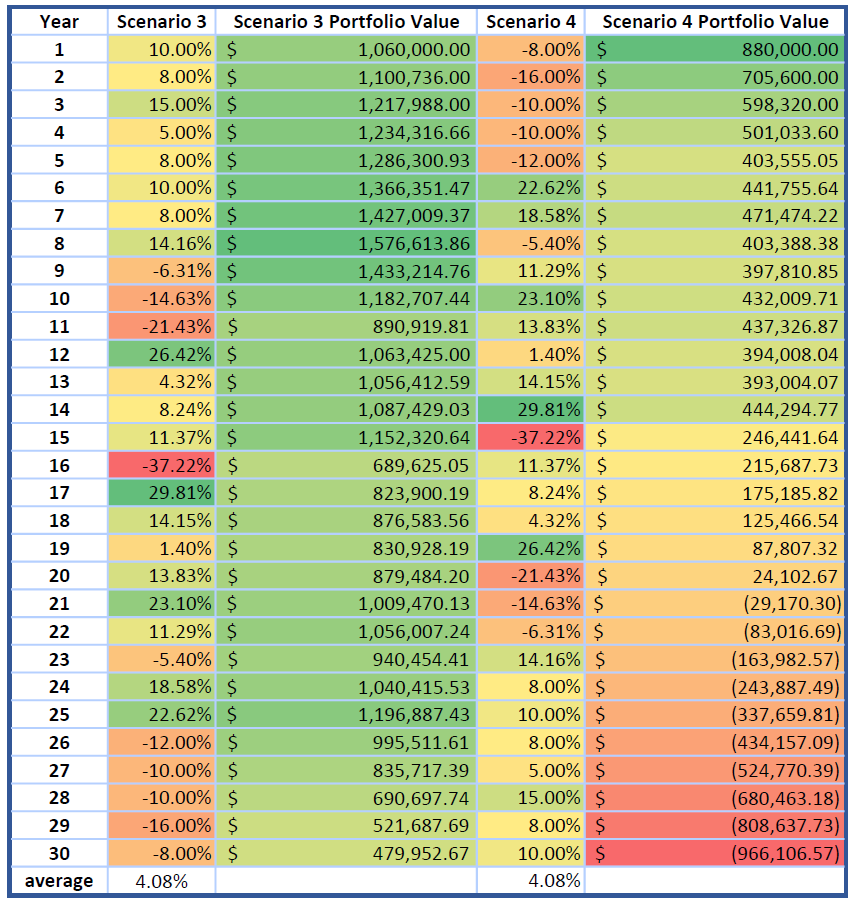
What about the 4% average annual return portfolios? These are in the table below. Both Scenarios 3 and 4 have an average annual return of 4.08% over the 30-year horizon. Using the same technique as the 7% table above, we simply reverse the order of the returns to illustrate how the sequence matters more than the average. Experiencing those 5 years of losses first causes Scenario 4 to run out of money after only 20 years of retirement, just like Scenario 2.
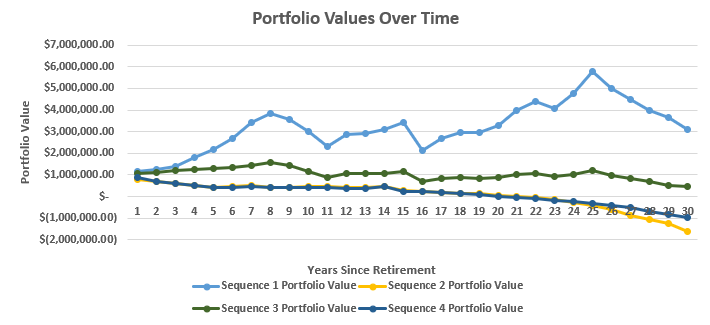
When you look at average returns for a retirement portfolio, know that the devil is in the details. Keep in mind that average returns and portfolio performance metrics can be very misleading! A higher average return does not necessarily equal a higher portfolio ending value in retirement – it’s all about the sequence of returns when it comes to safely retiring.
Having a well-constructed financial plan that relies not only on a diversified portfolio, but also a projection of future expenses and spending is key to weathering bear markets and protecting against sequence of returns risk. Historically, the worst year to retire was 1966 followed by 1929, but even in those years retirees were able to sustain a 4% safe withdrawal rate if they owned enough stock in their portfolio. Ask for a Certified Financial Planner™ professional with experience in retirement income planning to help increase your odds of outliving your money by getting the right stock allocation for your time horizon.
Anessa Custovic, PhD

