


I have a feeling we’re not in Kansas anymore!
Lions and Tigers and Bears! Oh My!
…shout Dorothy, The Tinman, and Scarecrow as they go down the yellow brick road. Despite knowing the risk on the horizon they stick to their plan and march forward. If you allow me the artistic license to make this an investment analogy, what they’re shouting sounds like 1980s Wall Street, and there are echoes continuing today.
Back then they weren’t shouting about wild animals, they were shouting about:
- LIONs! (Lehman Investment Opportunity Notes)
- TIGRs! (Treasury Investment Growth Receipts), and
- Bears (falling markets)
You won’t hear anything of LIONs and TIGRs today (neither are sold any more), but if you turn on the financial news today, the same grumbling about bear markets is there. There are so many articles about bear markets, but you may not know that the definition of a bear market is pretty general and subjective. For example, investment professionals generally refer to a bear market as a drop of 20% (and a bull market as a 20% rise) but offer no additional guidelines or structure. On the other hand, academics typically approach the question with a bit more rigor and rules, which allows for a deeper dive into the data where we can start to see some clear patterns.
In this post today, we are going to borrow the methodology from Lunde and Timmermann’s 2004 paper and share some of our insights. You might be surprised to find out the good news about bear markets.
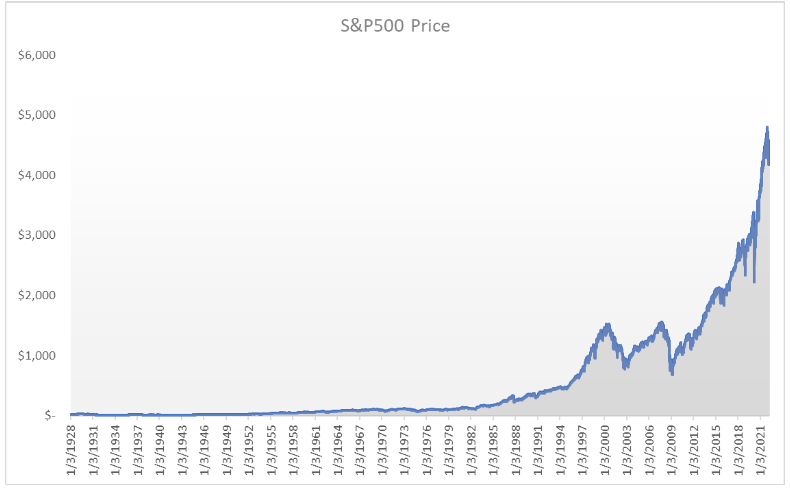
This graph shows almost 24,000 days worth of stock prices for the S&P 500 and its predecessor indexes going back to 1928¹. Without a doubt, there are periods of time where the price declines over time, but the overall path is up. It’s harder to see the daily data points here, but the graph also shows that the days the market moves the most are days that the market is moving up. This is a positive for long-term, buy-and-hold investors.
In fact, we see there are only 5,727 days during this period where the S&P 500 is in a bear market. Out of the full 23,662 days, there are bear markets only 24% of the time. All the bear market fortune-telling and worry is around a market environment that happens infrequently – it just hits especially hard on the human psyche because humans for the most part are loss averse. That means that a loss of 5% feels much worse than how good a 5% gain feels. If you are feeling anxious as prices fall, remember it’s important to speak with your financial advisor and share your feelings of loss aversion.
Enough psychology, let’s get back to data analysis.
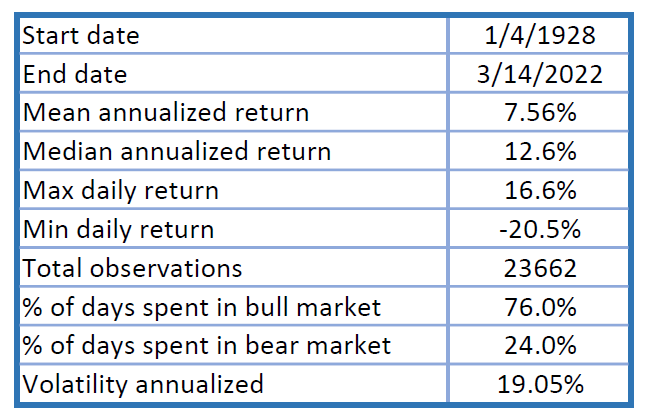
In the table we see that a long-long-term investor would have an average return of 7.56%. That’s a number you may have heard as an average return for a stock portfolio, but know that the devil is hidden in the details. For example, the median is 12.6%. What this means is that there are more days that the price increased well over 7.56% → showing again there are more big up days in the data than big down days.
The worst stock market day was in relatively recent history, October 19th of 1987, also known as Black Monday. Though no one predicted Black Monday, it came during a bear market between late August 1987 and December of 1987 (71 days long), and there were bull markets on either side (1,273 days of bull market before August 25th, 1987, and 659 days following December 4th). It took less than two years for the market to recover from Black Monday and less than one year to recover from the sell off in March 2020. The best day in stock market history was March 15th of 1933. It had a 16.6% return in one day and occurred between the Depression and a national banking crisis marshaled by FDR. Bear markets are not a reason to move your portfolio to cash, it’s all the more reason to invest in a diversified, low-turnover portfolio built to weather the bull and bear markets.
In summary, the daily data has a number of other diamonds hidden in it:
- The average duration of a bear market is only 133 days, but the median is even fewer days: 71. This means that most bear markets are generally short.
- The average bull market is 399 days! The median is only 137. The big difference between the average and the median implies that bull markets have the capacity to last abnormally long periods of time.
- The top 10 bull markets add up to 12,335 days, almost 50% of the days of the sample data.
- There are 16 bull markets longer than 400 days.
What about economic recessions? Recessions are commonly defined as two consecutive quarters with a decrease in real GDP. We overlaid the data from our study to identify whether bear markets are especially common if there is a recession. Our analysis of the data shows that an investor is about as likely to have a bear or bull market during a recession. Of the 45 bull markets and 43 bear markets, there were 28 bull markets and 26 bear markets during recessions. That’s a 62% chance of a bull market and a 60% chance of a bear market (don’t worry, our calculators aren’t broken – they don’t add up to 100% because you can have multiple market environments during one recession!).
So what are the key takeaways from this study?
Investing involves risk, sometimes substantial risk, but prudent, long-term investment of funds earmarked for the future has been a way to accumulate wealth for decades. Changes in the market, the world, politics, and technology will cause all types of bull and bear markets, but if history is any guide there will be more bull markets than bear markets. Undoubtedly, bear markets are painful. Often they can require adjustment, but they are mostly short lived, and the recovery is often dramatic (like a +16.6% day after the markets were closed for almost a week when the government declared a national bank holiday to steady the banking sector!)
Whether the weather is bullish or bearish, staying invested gives you the best chance at building wealth over time. If you are feeling anxious about your portfolio, consider working with a financial planner to help you better understand how you can realign your portfolio to use it throughout the ups and downs, no matter what wild animals the yellow brick road ahead brings.
Doug “Buddy” Amis, CFP®, and Dr. Anessa Custovic, PhD
¹S&P 500 daily price data is from Yahoo Finance and spans from 1928 – 2022.