


What Is Your Investment Horizon?
5 years? 10 years? 20 years?
Every good financial advisor asks you that question. Then they find the return associated with that horizon and build your plan. Right?… Wrong. Most likely they take the average monthly return, and then extrapolate to your horizon. That oversight misses important cyclical forces in the markets, and could put you on the wrong investing path.
In the series, Know your Benchmark, we document and explore various aspects of the risk and return profile of key benchmark portfolios. After all, not knowing your benchmark is like trying to measure without having a yardstick. In this edition, we focus on the holding period horizon.
Let’s focus on the S&P 500 over a very long period: January 1900-June 2020. In the time series chart we plot out the returns over time for 3 different holding period horizons: 1 month, 1 year, 10 years¹. The pattern is obvious: monthly returns are wild. As the holding horizon lengthens, there is less variability in returns. The implication is that if you hold for longer, the good periods balance with the bad periods.
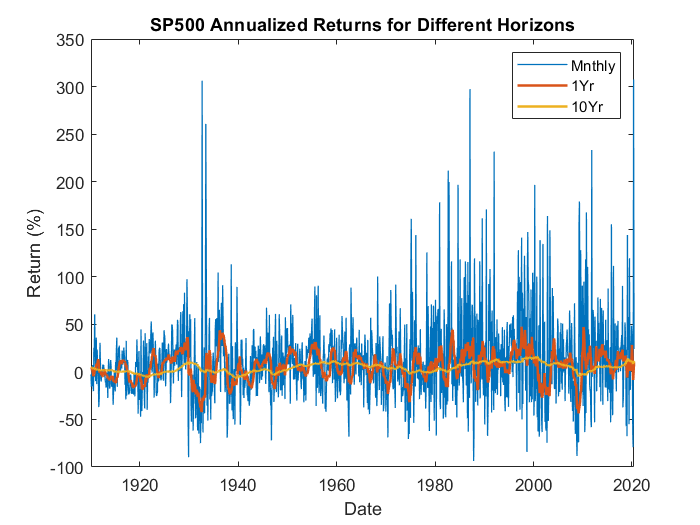
That variability is a common proxy for risk. Statistically, we often measure that risk with standard deviation. For a monthly holding period, the standard deviation of returns is 43%, for a yearly holding period it is 15%, and for a ten year holding period it is 5. As the holding period horizon lengthens, standard deviation falls.
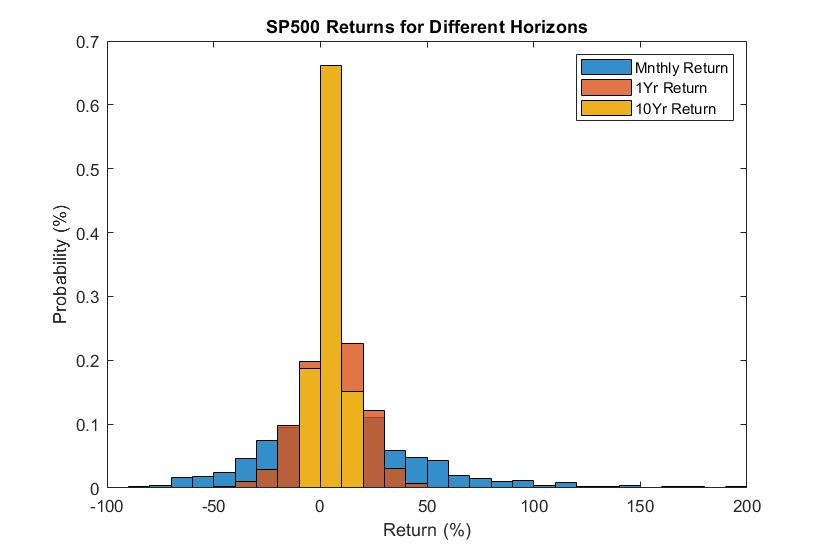
To really see the range of possibilities we like to use a (relative frequency) histogram. The figure below depicts the relative frequency of monthly, annual, and 10-year holding period returns. Notice the range of monthly returns is from -94% and 307%. Meanwhile, there is no 10-year holding period during this period with a return less than -6.77%.
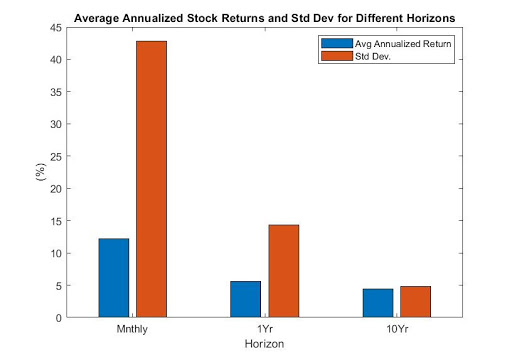
How does holding period horizon impact your portfolio? Consider the infamous 60/40 benchmark equity/bond portfolio. The table below depicts both return and risk of this benchmark portfolio.
Not surprisingly, average returns are highest for the shortest horizon portfolios, but so is the risk. Consider that, on average, the most you could have lost from holding a 60/40 portfolio over ten years is 38% over the period 1900-2020. Meanwhile, you could have lost virtually all of your money by holding for one year. Or said differently, the probability of losing money in a 10-year portfolio was 6.7%, while you had at least a 30% chance of losing money if you held for less than or equal to 1-year.
| Holding Period | 10 Year | 1 Year | 1 Month | |
| Mean Annualized Return | 4.62% | 4.38% | 10.1% | |
| Sigma | 3.47% | 9.08% | 28.02% | |
| Return/Risk | 1.33 | 0.48 | 0.36 | |
| Probability of Returning Less than… | 10 Year | 1 Year | 1 Month |
| -15% | 0% | 1.88% | 13.36% |
| -10% | 0% | 4.74% | 19.38% |
| -5% | 0% | 15.48% | 26.71% |
| 0% | 6.71% | 30.61% | 36.06% |
| 5% | 56.49% | 51.67% | 46.51% |
| 10% | 90.50% | 74.34% | 56.61% |
| 15% | 100% | 90.10% | 65.33% |
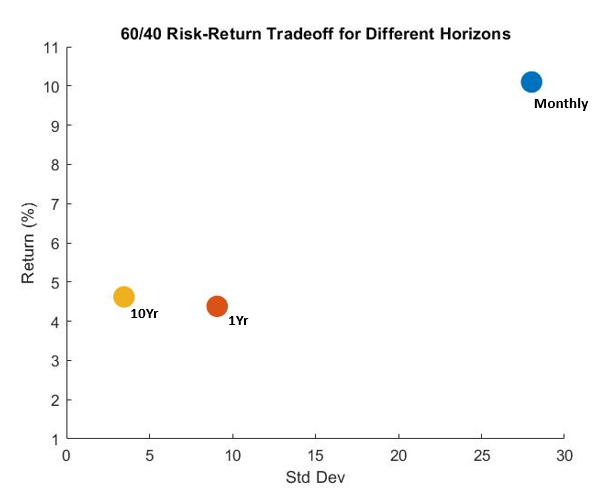
To get a sense of this risk return tradeoff, we can look to the risk return tradeoff figure. We prefer portfolios in the northwest; i.e. those with high return and low risk. Clearly, the monthly returns have dramatically higher risk.
The bottom line is that just knowing your horizon is not enough. Your benchmark needs to be built upon that horizon explicitly.
Dr. Anessa Custovic, PhD
¹S&P 500 monthly price index data pulled from FRED combined with S&P 500 price index data from Multip.coml to get a longer history. Historical monthly distributions are from Multipl.com
For 10 year returns, we compute rolling 10 year simple holding period returns from monthly data and annualize. For annual returns, we compute rolling one year simple holding period returns from monthly data. We compute simple monthly returns and annualize for monthly returns.
We used monthly S&P 500 data from FRED and multpl.com to form rolling 10-year holding period returns for the equity portion of the 10-year portfolio and 10-year YtM from Fred as the bond portion. For the one year horizon portfolio, we form rolling one year holding period returns from monthly S&P 500 data for the equity portion and compute annual holding period bond returns using the 10-year YtM from Fred. To compute annual bond returns, we assume a 10-year treasury is purchased, held for 12 months, sold and then another 10-year treasury is purchased the following year. We use monthly S&P 500 data to compute simple monthly equity returns for the equity portion of the monthly horizon and we compute monthly bond returns from the 10 year YtM from Fred. Similar to annual bond return calculation, we assume a 10-year treasury is purchased, held for one month, sold and then another 10-year treasury is purchased the following month. All returns are annualized. Data sample spans from January 1900 – June 2020.