


Bite-sized advice sounds so simple…but there’s a lot more going on behind the scenes.
Let’s Break it Down
I was recently quoted in an article for Bankrate about the differences between small-, mid-, and large-cap stocks. Let’s drill down into the data details of where that quote came from, taking a deeper look into different market cap equities, specifically small-cap (market cap between $300 million and $2 billion), mid-cap (market cap between $2 billion and $10 billion) and large-cap (market cap of $10 billion+) domestic equities. I proxy large caps with VFIAX, mid caps with VIMAX, and small caps with VSMAX¹.
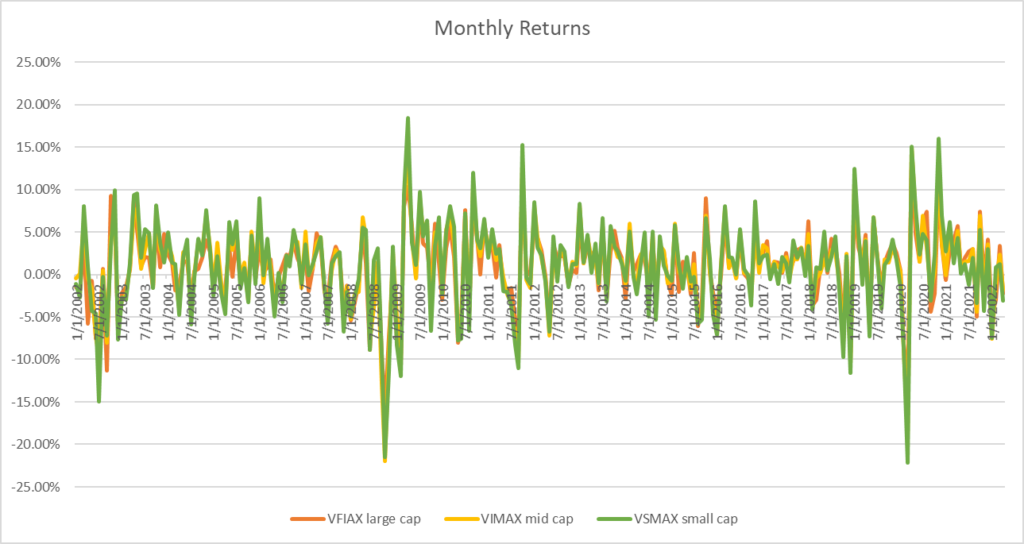
Let’s start by visualizing the data: below we look at the monthly returns for VFIAX, VIMAX and VSMAX. We see that the 3 mutual funds track one another very closely. In fact, the correlation of small caps and large caps here is about 0.90, large caps and mid caps is about 0.94 and mid caps and small caps have the highest correlation of about 0.97. So does that mean equities of all caps are the same? Absolutely not!
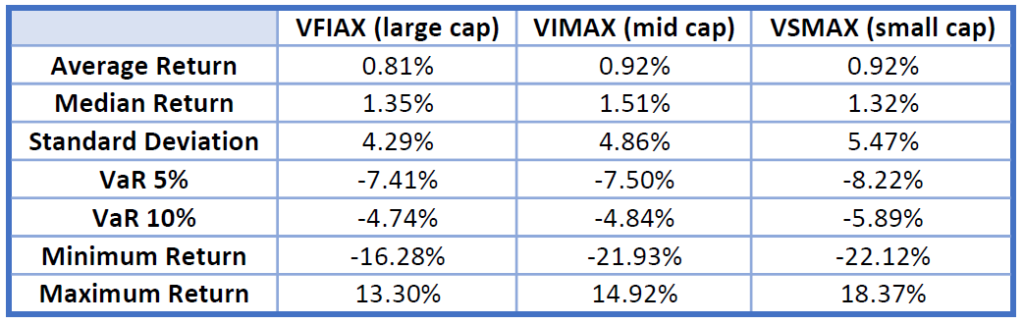
Looking at the table below we can see there are clear differences between the market caps. Given the median, average, and maximum monthly returns we see that the small cap fund has the potential to hit the highest returns. However, this potential higher return is not without risk! The monthly minimum return for small caps is -22% during this time period. Consider losing that much of your small-cap position in one month! That would be hard to stomach. Large caps have the lowest volatility, typically because the companies are more stable and established.
Now, we talk a lot about investment horizon here at Cardinal (there’s even a whole blog post about it), so let’s check how these funds perform when we look at 10-year holding periods vs. annual holding periods. Let’s start with the 10-year holding period returns (HPRs).
The data sample includes a recession BUT also the start of one of longest bull markets going forward. Looking at the plot below we see that small-caps and mid-caps are out performing early on in the sample.
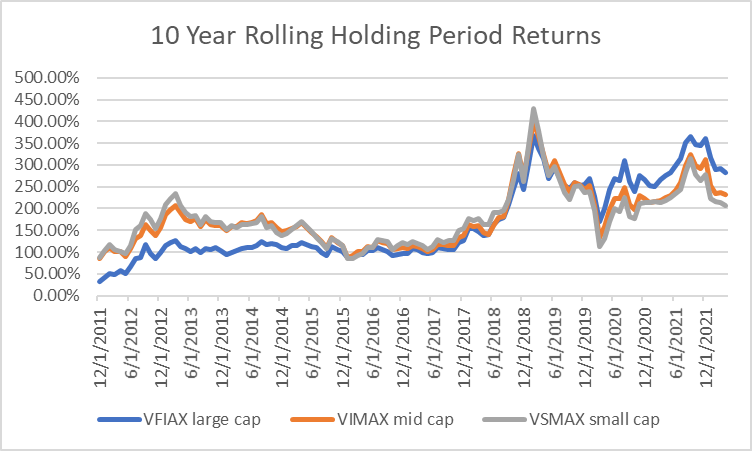
I take these 10 year HPRs and check which market cap outperforms each time. Small caps outperform about 50% of these 10-year rolling HPRs, while mid- and large caps outperform about 25% of the time. Chronologically, small caps are outperforming up to COVID drawdown, then we see large caps taking over. This makes sense, as small caps usually tend to get hit worse during downturns but outperform during early bull markets.
What about one year investment horizons?
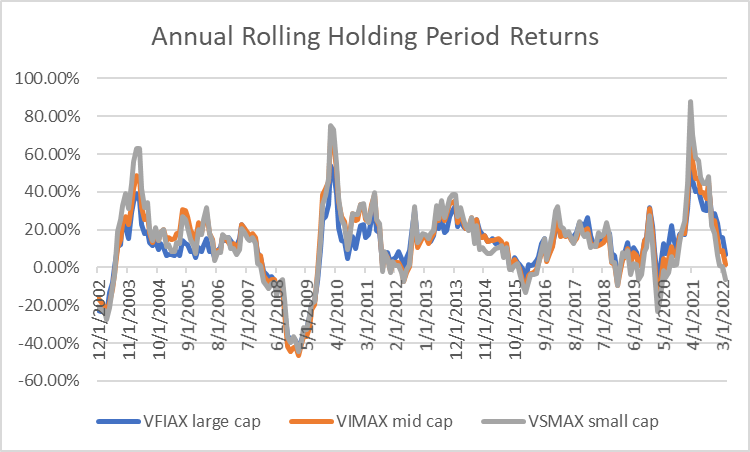
With a shorter time horizon, large caps outperform 41% of the time and small caps outperform 37% of the time. The annual holding periods capture bear markets and drawdowns or corrections, where large caps do better, so this is the main reason horizon matters with market cap differences!
So what’s all this mean for your portfolio? All market caps are not created equal, and there are opportunities to diversify across market caps in equities. Talk to your financial advisor if you’re not sure how much you should allocate!
Dr. Anessa Custovic, PhD
¹All monthly data is retrieved from Yahoo Finance and spans from 12/2001 to 4/2022