

Timing is everything, as the saying goes. Or is that really the case?
Missing the Best Days
As a data scientist and economist I love seeing studies with eye opening statistics. There are a few studies that measure the impact of missing the best market days and all of them show jaw-dropping differences in portfolio values when even a few of the best days are missed over a period of time. The argument is that staying invested pays off over time.
Let’s start with First Trust’s example covering December 31st of 1979 to December 31st of 2019.
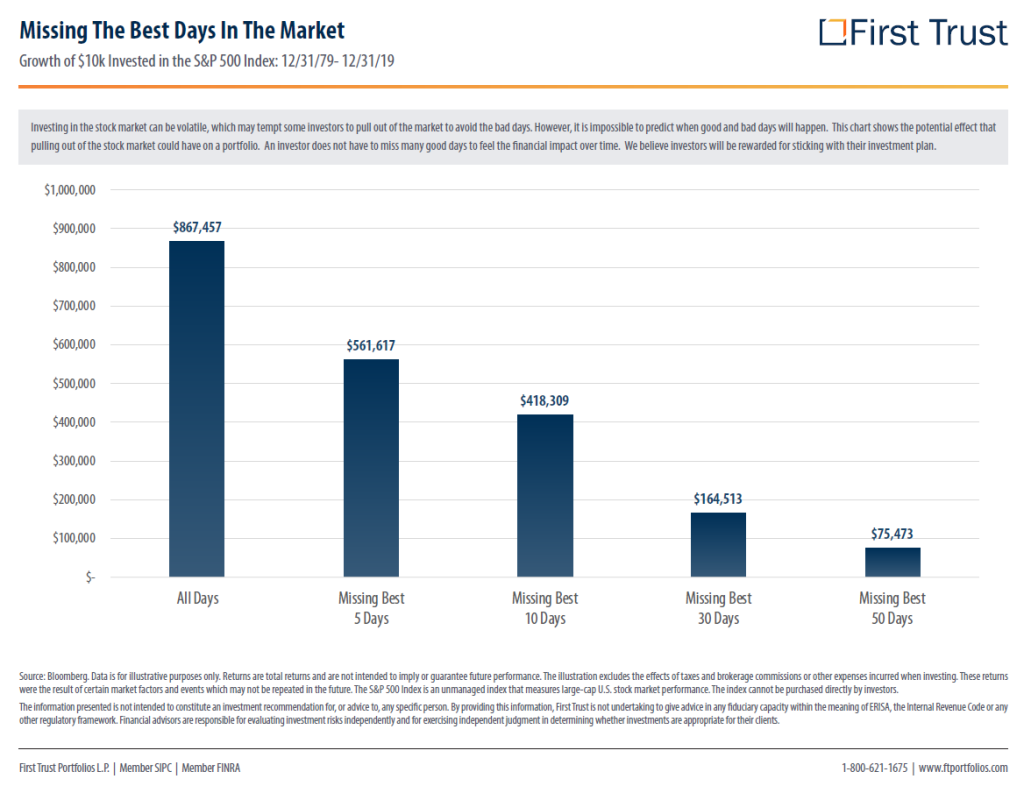
- Missing the best 5 days leads to a 35% loss compared to staying fully-invested
- Missing the best 10 days puts the portfolio at a 51% disadvantage
Now some of you might be pointing out that this period excludes the March 2020 sell off due to the Coronavirus and its effect on the economy. Conveniently, Fidelity has picked a similar period that includes the worst of the sell-off and a limited amount of the recovery. The story looks the same.
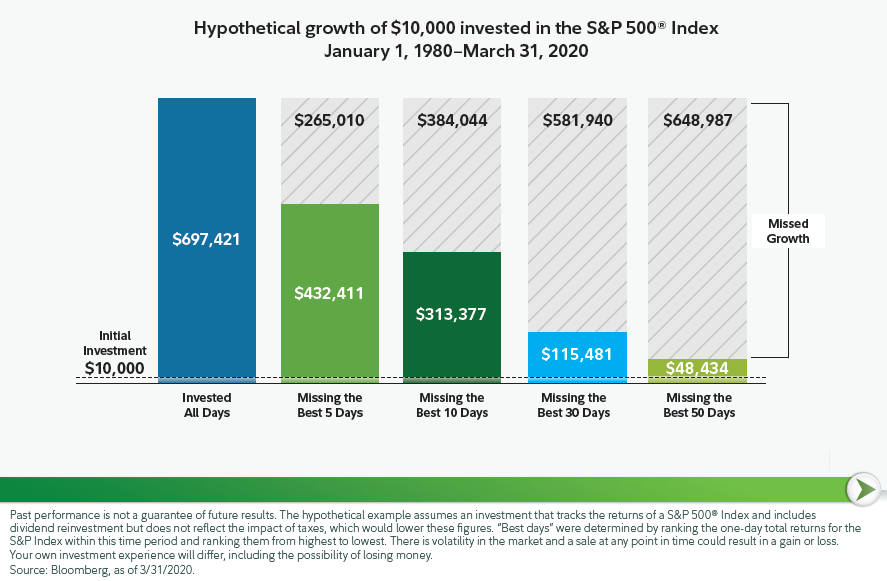
- 37% less if you miss the best 5 days
- 55% less if you miss the best 10 days
Putnam Investments picked a more recent timeline to study, likewise using $10,000 and the S&P 500 Index. You will see in the image below that even in this short time period there is volatility in the stock market as Lehman Brothers collapses, the U.S. credit rating was downgraded, the Brexit vote, and a trade war.
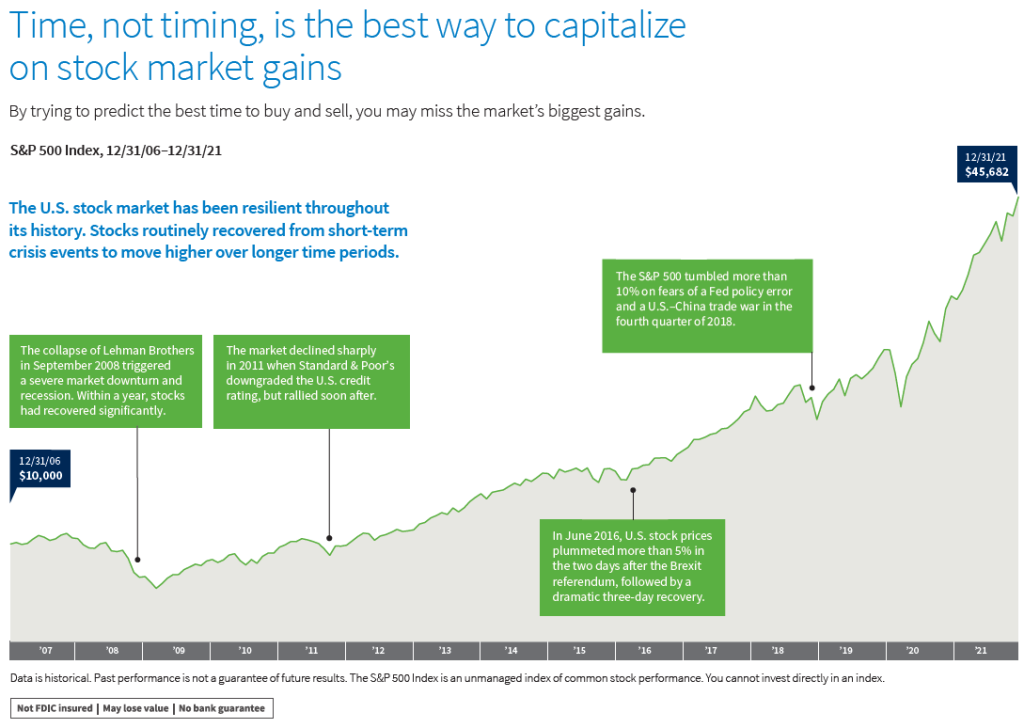
Despite those events the story is the same.
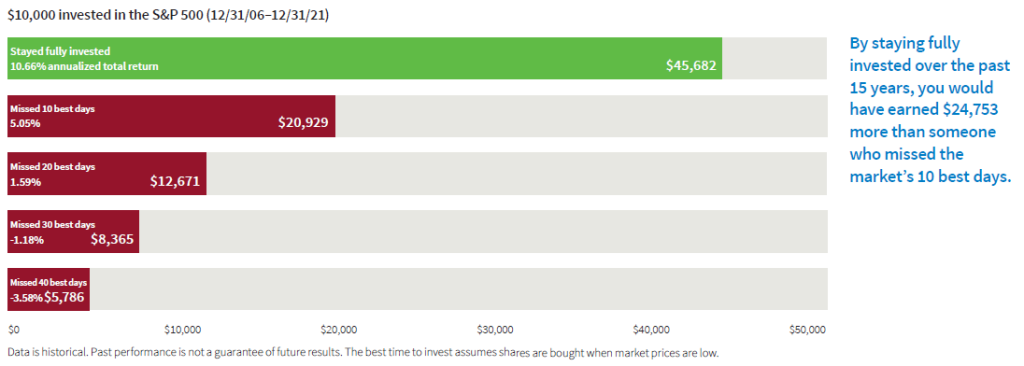
- Missing the best 10 days leaves the portfolio with 54% less
Dare I Say It, A Pattern Emerges.
Ever the skeptic data scientist, I was curious if there was some cherry-picking of data occurring. Each study I found published by a financial intermediary (e.g., a brokerage, advisor, or fund company) and their argument supports investing for the long run but is that not a conflict of interest? These businesses make money from people investing! Are they really picking a fair time period to study and base their recommendation on?
I wanted to know for sure and it looks like they are right. Let me show why with a simple study and one that may take a little more time to conceptualize.
The first thing I did was pull all the daily S&P 500 data all the way back to January of 1960. This data would let me test a nice long holding period (over 15,600 trading days!) and see if I had the same results.
- Missing the best 5 days leads to a shortfall of 38% — this is in line with the studies above
- Missing the best 10 days leads to a shortfall of 55% — also in line with the studies
Now that we’ve recreated a data set and experiment that looks to be in line with the likes of Fidelity, First Trust, and Putnam Investments, let’s dig into this a bit more and look at some recent events like the Great Recession and the Covid crisis. Would it have been better to just pull your portfolio out of the market and miss those periods entirely, good or bad days included?
Nope. The answer is to stay the course and stay invested.
Rolling Returns from January 1960
When I look at all 15,600+ daily S&P 500 returns in the sample and rank them from best to worst, the data shows that October to November of 2008 was particularly rough for investors. Out of sixty two years, 5 of the worst 20 days occurred in autumn of ‘08. That makes sense though – recall that Lehman would have just collapsed!
Would you believe me that the same October to November of 2008 also had 4 of the 20 best days? Even in the face of the financial system collapsing there were days of hope and these days matter.
If you had chosen to stay out of the markets during the ‘08-’09 financial crisis, you would have missed some of the best days and end up with far less than an investor that stayed the course. CNBC reports that Bank of America tested this too – their takeaway was that “investors should avoid the impulse to time the market.”
As an investment advisor, I wanted to make this data more actionable and true to life for my clients. Each of these studies picked a start and a stop date but there are so many more possible investment dates. If you are preparing for retirement, you may only have 30 years to grow your investments but you might not have that money on January 1st, or December 31st. To help address the concerns of our clients with their retirement account rollovers, their windfalls and inheritances, or just extra money to put into the market, we picked every 30 year holding period from January 1960 to February 2022.
That adds up to over 8,000 different possible start dates. If you can visualize 8,000 different investors all starting their investment journeys with $10,000 each and a 30 year time horizon, that’s the experiment I’m describing. Each one of these investors picks a different day to invest in the S&P 500, from January of 1960 to February of 1992.
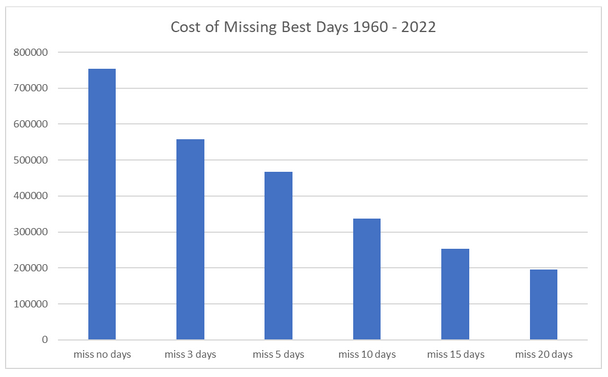
On average, over all the years and between all these investors, their portfolios should grow to $102,162.65 if they stay fully invested. The average losses are in line with the studies above:
- Missing the best 3 days is lower by 21%
- Missing the best 5 days is lower by 29%
- Missing the best 10 days is lower by 45%
Moral of the story? Without a crystal ball it’s been best to stay in the market than try to time the market. If you have reservations or doubts and feel like you need to pull out of the market consider speaking with our advisors to help decide if that really is the best strategy for you. You might need help adjusting your asset allocation or emergency funds to help you stay invested for the long run.
Dr. Anessa Custovic, PhD