
Putting recessions into historical context
The Ebbs and Flows of the Economy
In order to understand recessions and how they affect different parts of the economy and financial markets, we first need to understand the broader economic cycle. In general, we define the economic cycle as the period where the economy fluctuates between expansion and contraction stages; it’s also known as a business cycle. The National Bureau of Economic Research (NBER) determines when and how long each part of the economic cycle lasts.
An economic cycle has four stages: expansion, peak, contraction and trough. The news and financial investors tend to focus most on the contraction phase of the economic cycle, but it’s important to understand each phase and the role it plays in the economic cycle.
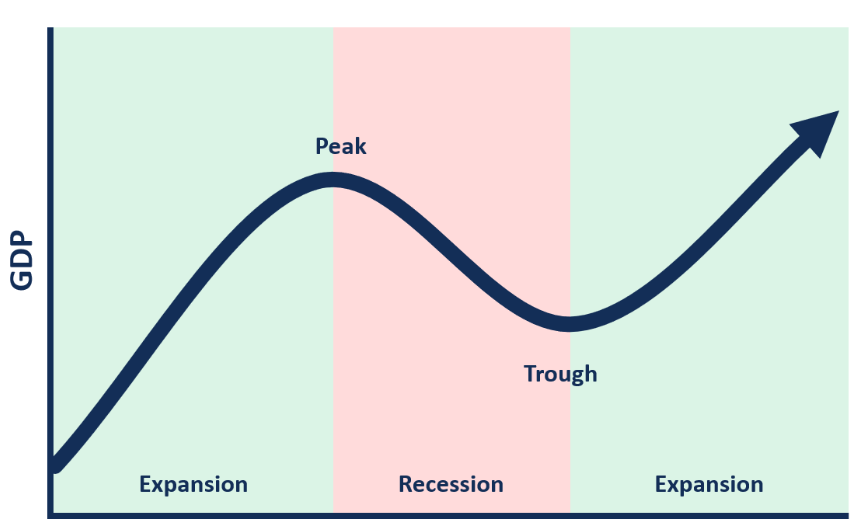
- Expansion refers to the period of time when the economy is growing steadily. During this time we see high production, low unemployment, and usually low interest rates. At this stage of the economic cycle we start to see inflationary pressures as the economy is heating up.
- The peak is when economic activity and growth reach the maximum level. An economic peak usually brings more inflationary pressure or other economic imbalances, which either directly or indirectly pushes us into the next stage.
- This next stage is called the contraction phase of the cycle. This stage is what everyone is afraid of, but it is a natural part of the economic cycle, as you simply cannot have an economy grow without bounds. We see loosening of the labor market and a decline in gross domestic product (GDP) among other macroeconomic indicators at this point.
- The lowest low during the contraction period is called the trough. This is the lowest growth, or in other words, this is as bad as it gets during economic downturns. Being the lowest point of growth means the trough is also the point at which the economy begins to recover from the contraction.
The contraction cycle is generally a recession – something we have been hearing more about recently. The most recent recessions have been extreme by historical standards, so let’s take a look at some recession facts from the NBER data before we move on. The plot below, from FRED¹, indicates each recession with a value of 1. It’s immediately apparent that in recent years the frequency of recessions has declined.
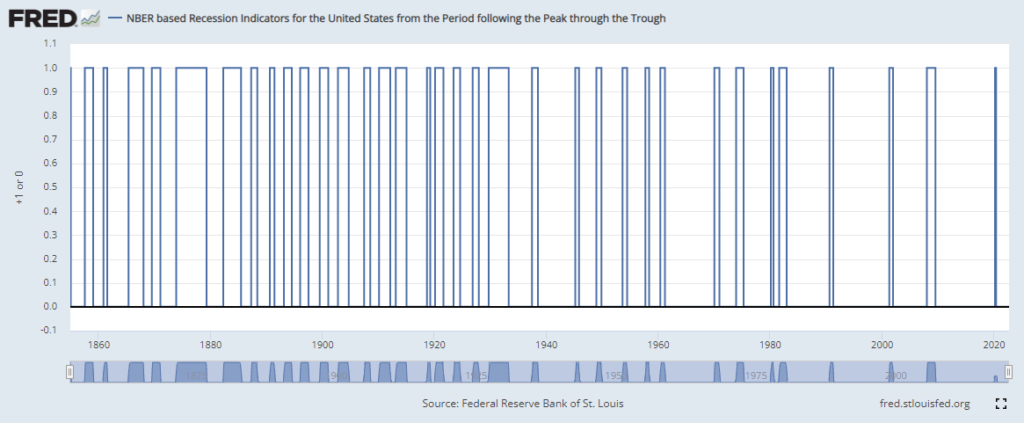
The NBER economic cycle dating goes back to 1854, giving us over 160 years of recessionary data. During these 160 years there were thirty-five recessions that occurred. During these recessions the average duration of the contractionary stage was seventeen months, and the average length of the expansion was about forty-one months. So, historically, we are in an expansionary phase more than twice as long as we are in a contraction. The contractions just feel longer because they tend to be full of economic pain and uncertainty.
Between 1854 – 1919 there were seventeen recessions, accounting for 49 percent of all documented recessions. During these seventeen recessions the average duration of the contractionary stage was about twenty-two months and the average length of the expansion was about twenty-seven months. The length of time we spend in contractions is much longer here than in the other subsamples.
Between 1919 – 1945 there were seven recessions, accounting for 20 percent of all documented recessions. During these seven recessions the average duration of the contractionary stage was about eighteen months and the average length of the expansion was about thirty-five months.
Between 1945 – 2020 there were thirteen recessions, accounting for 37 percent of all documented recessions. During these thirteen recessions the average duration of the contractionary stage was about ten months and the average length of the expansion was about sixty-four months. That means over the last seventy years or so we have spent six times longer in an expansion than a recession. This is also likely why it’s so scary to be faced with a recession in the present – we’ve been experiencing fewer contractions and enjoyed more stable economic growth than any other period of time in our history.
Ripples in the Economy
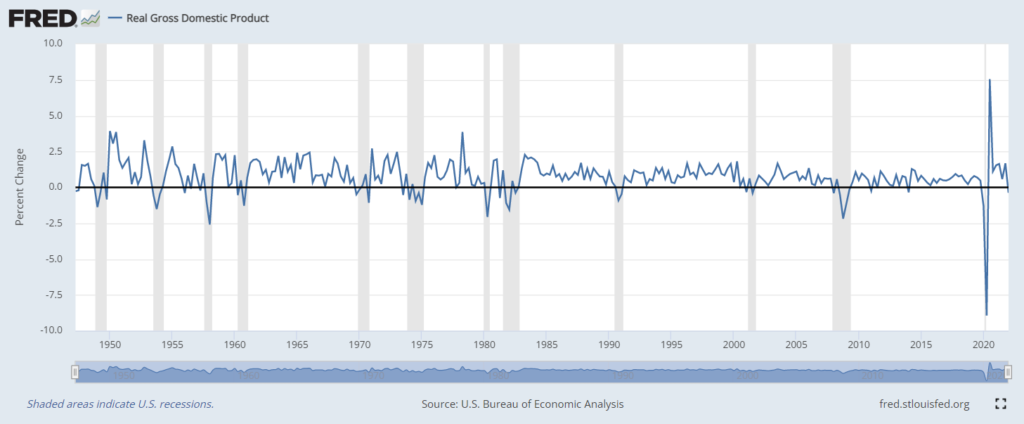
With recessions and economic contractions, one of the macroeconomic indicators that is closely watched is GDP growth. We expect to see a decline in GDP during these parts of the cycle. Now let’s take a look at what happens well before, during, and after these cycles to GDP, using twelve recessions starting in 1948 due to GDP data availability.
As expected, the GDP for the peak growth quarter is positive, with a steep decline in GDP for the trough quarter. The average peak-month GDP over these twelve cycles is 3.02 percent and the average GDP during the trough month is -2.17 percent. In each cycle analyzed, six months after the trough there is a rebound, with an average GDP of 1.96 percent at the end of those six months. In the plot below from FRED we see the percent change in GDP with recessions shaded.
Another hugely important measure of economic health is the unemployment rate. High unemployment is usually synonymous with a recession or economic contraction. Again, let’s see what happens to the unemployment rate during the twelve economic cycles starting in 1948.
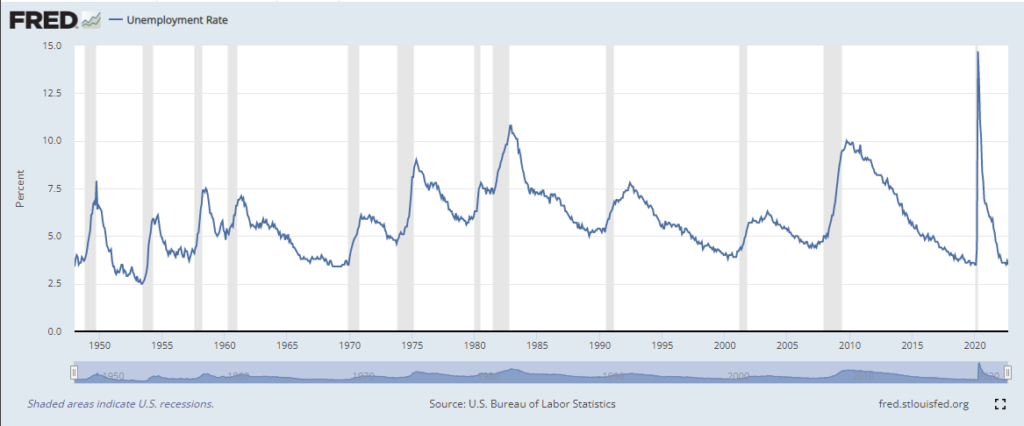
The peak-month unemployment rate on average is 4.64 percent, well below the overall average for the full period (1948-2022) of 5.74 percent, with the unemployment rate six months before the peak on average even lower than the peak month. In the cycles analyzed, unemployment rises during the trough month on average between 3-4 percent compared to peak-month unemployment. The average unemployment during the lowest low of the twelve recessions is 8.14 percent, well above the long-term average. Then, six months after the trough, in eight out of twelve recessions there is a decrease in unemployment – an improvement in the labor market. This is usually when the recovery is starting, sometimes much quicker than others. The average unemployment rate six months after the trough is 7.14 percent, a full percentage point lower than the trough average.
The plot below from FRED shows the unemployment rate since 1948 with recessions shaded. We see that unemployment starts rising at the start of a recessionary period, then peaks and gradually declines. The exception to the gradual decline in unemployment is the reopening of the economy after COVID closures. There we see a much more dramatic and sharp drop in unemployment.
Inflation is a hot topic now, but it has always been a closely followed macroeconomic indicator, as it has important implications for the economy and consumers. The data for inflation goes back to 1900, so we are able to analyze how inflation behaves during all economic cycles dating back to 1902. Experts in this area suggest that an ideal rate of inflation is about 2 percent.
Inflation six months before the peak month is on average 5.42 percent, and in the peak month it’s on average 6 percent. The historical average from 1902-2022 is 3.15 percent. This confirms that peak months and months leading up to the peak on average run hot – one of the reasons a contraction usually has to occur is to cool this. Inflation in the trough month is typically much lower than the peak-month inflation, an average of 1.10 percent. This really emphasizes how deflationary recessions can be, reducing inflation on average by about 5 percent. Inflation six months after the trough is about 2.25 percent on average, so six months after the trough in the economic cycle we see inflation near the desired long-term average. This is not the case for every historical recession, but it’s clear that six months after the trough, during the recovery period, inflation is starting to stabilize to a more desirable level.
Effects on Wall Street
Now we turn to the broad equity market represented by the S&P 500. It’s commonly said that the equity market tends to front-run a recession or contraction, beginning to recover during a recession, not after. We looked at all of the economic cycles going back to 1902 to assess whether this is a common pattern the S&P 500 does in fact follow (or not). During this time, there were twenty-three economic cycles.
On average the S&P 500 is negative six months before a recession, seeing a mean return of 0.10 percent but a median return of -2.23 percent. Out of the cycles analyzed, in thirteen of them we see negative returns six months before the peak month. So, more often than not, the S&P 500 will front-run a macroeconomic decline even when the economy has yet to officially peak. When we look at the six months leading up to the peak from 1948-2022, the average return is -1.27 percent.
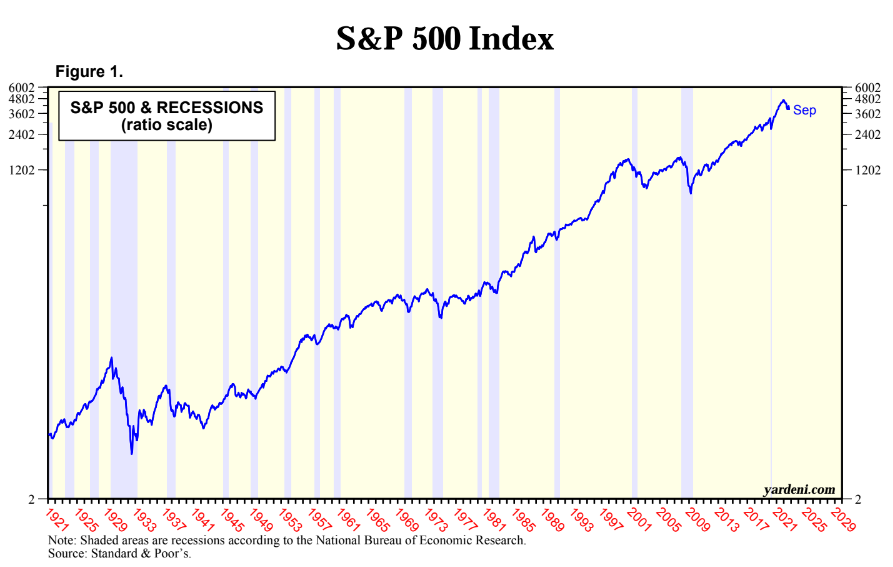
During the contractionary stage (from peak to trough), the S&P 500 has an average return of -8.52 percent. Since 1948 the average contraction return has been an improved -4.80 percent because the Great Depression heavily skewed the S&P 500 market losses. During the entire period from 1902, 56 percent of the time the return from peak to trough is negative for the S&P 500, but that also means 44 percent of the time when the economy is sliding into a recession, the S&P 500 does not follow with a steep decline. Since 1902, six months after the trough month the S&P 500 has had a positive return in every economic cycle. The average return six months after the trough is 17.32 percent, a fairly significant rally .
The plot below taken from Yardeni Research shows the S&P 500 price from 1920 to present with recessions shaded.
Macroeconomic data is released with lags and with revisions. This makes it incredibly difficult to identify recessions or contractions at the exact moment it’s happening. Recessions are officially labeled only after they occur. The only true exception to this was the COVID recession when all economic activity ceased simultaneously.
Remember what they say: history doesn’t repeat, but it rhymes. We can draw inferences from historical episodes to better understand how the economy and our financial portfolio will behave. Make sure you are prepared for all the ebbs and flows with cash reserves in savings and focusing on building a robust portfolio. Not every portfolio is built to survive these types of economic downturns and simultaneously take advantage of the recovery that follows. If you need help building a resilient investment portfolio contact us here at Cardinal Retirement Planning or find another fiduciary advisor.
Anessa Custovic, PhD
1. Federal Reserve Economic Data from the Federal Reserve Bank of St. Louis, one of twelve banks of the Federal Reserve System