


An overview of factor investing and what it means for the average investor.
Introducing Factors
Broadly, investment professionals refer to factors as something that might influence an asset’s return. To understand factors and how they came about, we have to go all the way back to the 1960s when the Capital Asset Pricing Model (CAPM) was invented. The CAPM introduced us to the concept of a stock’s beta, which the CAPM identified as one of the main drivers of the stock’s current and future performance. An asset’s beta is a measure of volatility or risk compared to the broad market (like the S&P 500®). Beta can be positive or negative, indicating whether a stock moves with or against the broader market (the amount of correlation), and the bigger the number, the more the stock moves compared to the broader market (the magnitude of change).
Prior to the advent of the CAPM, investors analyzed fundamentals (things like cash flow, balance sheets, and debt ratios) of individual stocks and attempted to pick what they felt might outperform the market. The CAPM gave investors a baseline by which they could judge expected returns. Building on this, economists Eugene Fama and Kenneth French introduced the concept of factors, characteristics that drive return, in the 1990s, revolutionizing investing. The initial study focused on the size and value factors.
Since the initial Fama-French study there has been an explosion of factors, many of which have failed the test of time and are not considered true factors or worthy ones. Financial professionals are constantly debating which factors are worth considering; for example, ESG as a factor is a current popular topic of discussion. However, there are many factors that have proven pervasive and persistent throughout time and can provide useful information leading an investor to returns above the expected market return.
Introducing Fama-French Factors
The initial Fama-French study looked at the stock’s beta, value and size – known as the Fama-French Three-Factor model. Soon after, Fama and French released their Five-Factor model with the addition of momentum and quality. In addition to this model, it’s important to know that there have been so many factors documented over the years, that it is commonly referred to as the “factor zoo.” Each factor is attempting to capture what premium – additional potential return – you can gain by focusing on particular characteristics of companies when choosing which one to invest in. In this blog, I will focus on the most well-known and easily actionable factors: the premium of size factor, the premium of value factor, the premium of quality factor, and the premium of popular momentum factor. Let’s look at what these factors mean.
- Size (aka SMB, Small Minus Big): the premium based on market capitalization. In other words, that means that this factor is calculated by looking at companies classified as “small cap” or “large cap” (comparably small or large total value of all available shares) and subtracting the returns of the large companies from the small companies over a given period of time. Since small-cap stocks historically realize higher returns, it tries to capture that premium.
- Value (aka HML, High Minus Low): the premium based on book-to-market ratios, the difference between the price a stock would be expected to sell for based on its financial records and the price it actually sells for. This tries to capture the premium that value stocks, or stocks that appear to be underpriced, have over the broad equity market.
- Quality (aka RMW, Robust Minus Weak): the premium of firms with robust operating profitability over those with weak operating profitability – which companies have a strong history of making money from their core business.
- Momentum (aka Mom): the premium that high-returning firms tend to continue having high returns and vice versa.
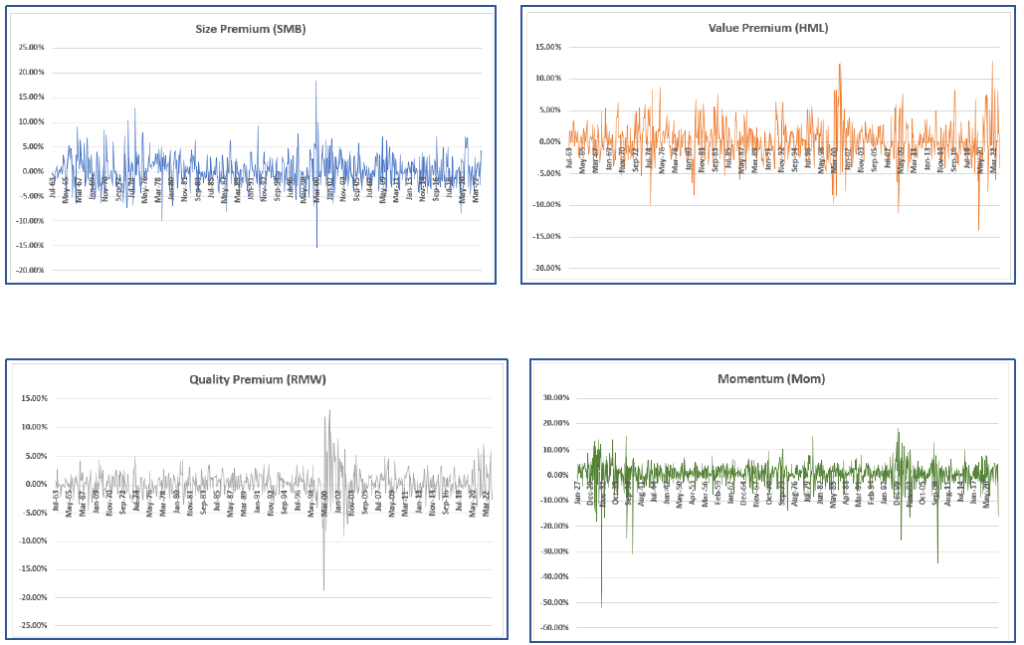
In theory, using factors to select investments can enhance portfolio return and offer diversification benefits. The premium of any given factor tends to vary over time (as you can see above).¹ It’s very important that they are part of a buy-and-hold strategy versus an active/frequent trading strategy. It is also very important to keep your goals in mind when deciding whether or not a factor, or factor investing overall, is right for you. Some factors carry risk above that of the broad equity market, which is not appropriate for everyone.
Analyzing the Factors
In order to show how factors work in the real world, I analyzed the statistics and correlations for sample portfolios over 715 months (July 1963 to January 2023) for the four premium factors discussed above: size, value, quality, and momentum. In order to judge the ongoing relevance of the factors, I looked at the full sample statistics and three sub-samples: July 1963 through December 1980, January 1981 through December 2000, and January 2001 through January 2023.
Performance of Each Factor Overall
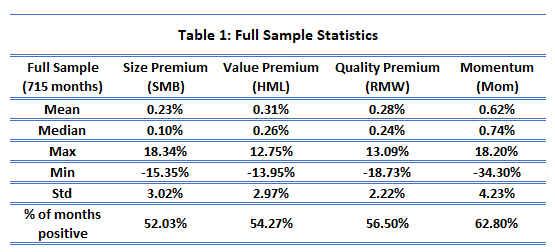
Looking at the full sample statistics, the mean and median premium for all four factors analyzed are positive. Table 1, above, presents these results. For the size premium, the mean implies that small-cap stocks outperformed large-cap stocks, on average, by 0.23 percent over the full sample. Likewise, for the momentum premium, the mean implies that stocks that are realizing high returns continue to outperform lower-returning stocks, on average, by 0.62 percent over the entire sample. The higher the percentage, the more “extra” money your investments potentially earn per month than if you hadn’t considered that factor.
The row “% of months positive” tells us the percentage of months in the full sample where the factor premium was positive. Each factor has a value of over 50 percent, meaning that, more often than not, this factor premium will work in a buy-and-hold portfolio because it is more likely than not to provide the premium benefit over time; this is evidence of its persistence. Momentum has the highest probability of positive months with a value of 62.80 percent.
Confirming the Results
For a factor to be considered legitimate, it must be persistent through time; it cannot be a short-term fad. Looking at the data from the sub-samples (see Tables 2-4 here) helps to explore this persistence, and some findings immediately stick out. Mainly, that the factors under consideration do appear to be persistent and pervasive throughout the entire sample, with a few notable exceptions that can be explained by specific macroeconomic conditions during that sub sample.
The size premium was, on average, negative in the sub-sample 1981 through 2000 (shown in Table 3). This means that, on average, large caps earned a premium over small caps during that period of time. The percentage of months the premium is positive is also below 50 percent, implying that more than half of the time over those years large caps outperformed small caps.
The only other time the percentage of months falls below 50 percent for a factor premium is in the sub-sample 2001-2023 (shown in Table 4), with the value premium dropping to 48.30 percent. During this time, the value factor also had a negative median premium of -0.08 percent. The opposite of a value stock is a growth stock, one that may be high-priced but is expected to continue growing. This means that over the last twenty years, growth has outperformed value more often than not, which makes sense given the performance of many tech companies over that time frame.
Despite these exceptions, overall I believe these factors have proved their legitimacy because of their consistent premiums across sub samples and the full historical sample.
Mix and Match Your Factors
Now that we know the factors are persistent, we have to ask how these factors move together. In other words, what are the correlations between these factors, and do the correlations change over time? Table 5, below, provides the full sample correlations among the factor premiums. Tables 6 – 8 provide the correlations among the factor premiums for each sub-sample.
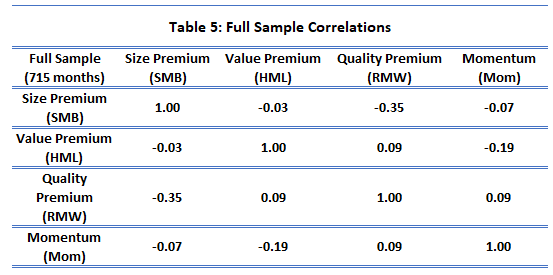
We can see from the tables that the quality and size premiums are negatively correlated in all sub-samples and the full sample. Similarly, the momentum and value premiums are also always negatively correlated in the samples I looked at. Whereas the other factor combinations have time-varying correlations, sometimes positively correlated to one another and at other times negatively correlated. These sample statistics and correlations are in line with the belief that factor investing should be part of a long-term investment strategy because you cannot predict which specific month will have the highest benefit, but over time the benefits should merge toward the average.
Real Life Factor Investing
A natural question is, now how do you actually invest in these factors? To identify individual firms you want to invest in, you could download information on stocks and use a program like Excel to create filters, or download special software. Another, simpler option is to invest using ETFs. There are a number of different ETF providers that offer a variety of factor ETFs.
Be careful though! It’s a zoo out there – remember some factors aren’t necessarily true factors; there will be factor ETFs available based on factors that are still hotly debated, and they won’t have any big red flag to warn you. If you need help choosing which factors work best with your portfolio, reach out to Cardinal.
Anessa Custovic, PhD
1. All data for this post is taken from Ken French’s data library and spans from July 1963 through January 2023. The factor data can be found here: https://mba.tuck.dartmouth.edu/pages/faculty/ken.french/data_library.html