


Diversification is a powerful force, but its benefit varies through time.
Do You Know Your Benchmark?
If you answered “sure, it’s a 70/30 stock/bond”, that’s good, but not enough. You need to KNOW your benchmark.
In this series (Know Your Benchmark) we explore various aspects of the risk and return profile of key benchmark portfolios. After all, not knowing your benchmark is like trying to measure without a yardstick.
In this edition, we focus on diversification. We all know the saying “Don’t put all of your eggs in one basket.” Does that saying hold up to the data? Does diversification actually work?
To address this question, let’s start with a 70/30 stock/bond portfolio. The stock portion consists of the IVV¹ and the bond portion consists of TLT². We compute rolling one year holding period returns from monthly data³. For each one year holding period return, we compute the portfolio variance as follows:
σ²ₚₒᵣₜ = ω²ᵢᵥᵥσ²ᵢᵥᵥ + ω²ₜₗₜσ²ₜₗₜ + 2*ωₜₗₜ*ωᵢᵥᵥ*σ₍ᵢᵥᵥ₎₍ₜₗₜ₎
where ωᵢᵥᵥ is the portfolio weight on IVV, ωₜₗₜis the portfolio weight on TLT, σ²ᵢᵥᵥ is the variance of IVV, σ²ₜₗₜ is the variance of TLT, σ₍ᵢᵥᵥ₎₍ₜₗₜ₎ is the covariance of IVV and TLT, and σ²ₚₒᵣₜ is the portfolio variance.
Now, let’s decompose that portfolio variance. How much is due to stocks? How much is due to bonds? How much is due to the interactions between stocks and bonds? We call that last piece the diversification effect.
Specifically, we can compute the contributions to total portfolio variance for each of these three pieces as follows:
Contrᵢᵥᵥ = (ω²ᵢᵥᵥσ²ᵢᵥᵥ)/σ²ₚₒᵣₜ
Contrₜₗₜ = (ω²ₜₗₜσ²ₜₗₜ)/σ²ₚₒᵣₜ
Contr₍ᵢᵥᵥ₎₍ₜₗₜ₎ = (2*ωₜₗₜ*ωᵢᵥᵥ*σ₍ᵢᵥᵥ₎₍ₜₗₜ₎)/σ²ₚₒᵣₜ
where Contr₍ᵢᵥᵥ₎₍ₜₗₜ₎ is the contribution to variance coming from diversification.
Impact of Diversification
In the figure below, we see how the risk decomposition for a 70/30 portfolio changes over time.
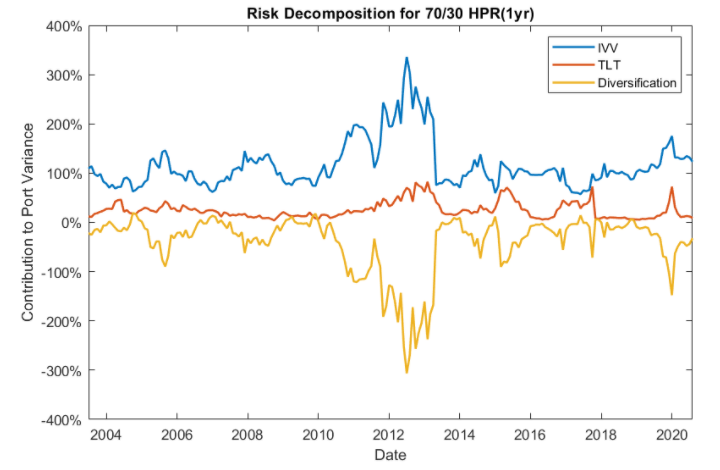
The equity portion of the portfolio is, unsurprisingly, the largest contributor to portfolio variance over time. During times of market volatility, we see that the contribution can be as high at 336% of portfolio variance. The equity risk contribution ranges from a minimum of 56% to a high of 336% during the sample period, whereas the bond risk contribution ranges from a minimum of 4% to a high of 82%.
Notice that the benefit of diversification varies greatly over time. At its peak in 2012, diversification resulted in about a 306% reduction to total portfolio variance. During that time period, equities and bonds were highly inversely correlated, resulting in a large drop in portfolio variance due to diversification.
When equities and bonds are highly correlated, as they were in 2004, diversification contributed about 19% to the total portfolio variance. Since the start of 2020, equities and bonds have been moving in the same direction, steadily decreasing the benefits of diversification. If they continue moving in the same direction, it is possible we experience another period where diversification will increase total portfolio variance rather than decrease it.

Example Case Study
Variance is not the only measure of risk. There are myriad others. One alternative is the Value At Risk, which we can think of as the return in a worst-case scenario. Technically speaking, we usually calculate the VaR at the 95% level, resulting in the return that is worse than 95% of the possible scenarios.
Consider the 70/30 portfolio discussed above alongside a second portfolio where we invest 70% in IVV and hold 30% in Cash. We assume the cash holdings earn 0%, but more importantly, that 0% return is fixed, implying that it offers a known, small, benefit of diversification.
The VaR for the 70/30 stock/bond portfolio is -11.72%. Meanwhile, the VaR of stock / cash portfolio -14.25%. By reallocating 30% of the funds from cash into TLT, we can decrease the portfolio VaR by 2.53%.
In summary, the benefits of diversification vary through time. However, on average, diversification remains a powerful force for even simple stock/bond portfolios.
Dr. Anessa Custovic, PhD
¹The IVV ETF tracks the S&P 500 index and is thus a good proxy for equity returns. Monthly price data for IVV is from Yahoo Finance.
²The TLT ETF tracks the Barclays 20+ Yr Treasury Bond index and is thus a good proxy for long term bond returns. Monthly price data for TLT is from Yahoo Finance.
³Rolling one year holding period returns are computed from monthly simple returns of IVV and TLT. We compute simple returns from adjusted close prices, which take dividends and stock splits into account. The data spans from July 2002 – August 2020.